Multi-Dimensional Data Visualization

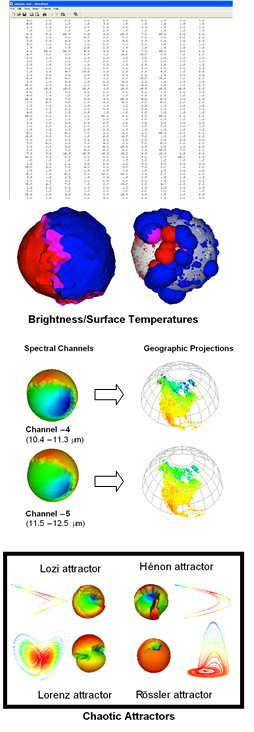
Scientists and engineers rely on graphical visualization and visual analysis tools to interpret large volumes of complex, high-dimensional data. Visual cues enable the analyst to quickly detect the existence and relative magnitude of interesting variations, or novel information, in seemingly arbitrarily organized lists and tables of numeric data. This research investigates how colourized closed surface representations of n-dimensional data vectors can be created using self-organizing feature maps (SOFM) and displayed in virtual reality (VR) environments. The SOFM is a topology preserving mapping from high-dimensional features vectors to a three-dimensional lattice.
The assignment of n-dimensional vectors to specific lattice nodes is based on unsupervised clustering. Further, the topology preserving mapping operation ensures that nearby vectors in the 3D coordinate space are mapped to neighbouring nodes on the lattice structure. The statistical variance, or level of similarity, amongst the input vectors assigned to a common lattice node will determine the local shape of the graphical form. Additional information can be superimposed on the graphical form as colours to reflect other key data attributes or pattern classification assignments. By maintaining a record of the input vectors assigned to each node in the lattice it is possible to trace backwards through the database to those n-dimensional input vectors that had contributed to significant changes in surface shape or color, thereby indicating the presence of anomalies or incorrect classification.